In May 2020, Google announced that the on-page experience is becoming increasingly important. They call them the Core Web Vitals.
What are the Core Web Vitals? What does it mean and what can we do with it? Why was this created? What good is that to you as an entrepreneur? Are these new factors that determine how well your website can be found on the Google search results page (SERP)? So what does it mean for your SEO?
In its latest post on Google’s Webmaster Central Blog, Google indicates that the algorithm will include Core Web Vitals from May 2021. Core Web Vitals are three factors that play a role in the page experience (user experience on the page). If you score well on this, this will improve the rankings of your page.
This update is completely in line with Google’s vision of user-friendliness becoming an increasingly important factor. We have seen this more often in recent years with updates to website security via HTTPS, but also Mobile First Indexing, the E-A-T update, and website speed.
The page experience signals from Google contain 3 new signals from next year: the Core Web Vitals.

Google defines Core Web Vitals as follows:
“It’s a collection of user-centric metrics and thresholds that apply to all web pages in all industries and all types of experiences on the web. They are signals for developers and stakeholders or interested parties about the basic health of your site. And as such, they should be measured by everyone.”
But there are already a lot of metrics that are being measured. Why has Core Web Vitals suddenly become important?
As mentioned in the previous section, there are already a lot of metrics that are measured and provide insight into the performance and quality of websites. Think of the speed of the website itself, the time it takes to load a website, safety when surfing, etc. Then again, why Core Web Vitals?
Google’s goal is to give its users a good user experience. When people use Google’s search engine, Google wants to show the best results that answer the questions people ask. Hence, Google is constantly improving its search algorithms.
Google puts it like this:
“We want to create an extraordinarily phenomenal experience for all of our users.”
Every time they have a user who is dissatisfied or frustrated with the Internet, it means to Google that they are losing a reader, customer, or client. Also, a good user experience is a revenue model for Google as they earn their money through advertisements, among other things.
Every day millions of websites go live with more and more content. Videos, music, podcasts, blog posts, etc. Besides, the websites become more and more sophisticated in terms of functionality and design, and more challenging and interactive. To make this possible, programming languages such as Javascript, HTML and CSS are used.
Adding functionalities makes websites increasingly heavy. That means more code to be sent over the line to bring the website up on your screen. Although the websites contain more functionalities and look slicker, it does mean that they also lose speed.
So Google set itself the goal of seeing if they can improve the web. To do so, they need to be able to measure what’s important to find out if they’re making progress.
The question they asked themselves was, “What makes a great web experience?”
What does quality mean when it comes to web experience? What fundamental elements determine whether a website will provide a great user experience?
A number of characteristics that are mentioned:
Users don’t want to wait for content to load. If a website doesn’t load within 4 seconds, your visitors will leave your website. Page speed is therefore one of the major factors when it comes down to technical SEO.
You are on a website and you click or swipe left or right but nothing happens. That is bad and you will doubt whether the website is working. Content should not only be visible, but you should also be able to do something with it.
You probably recognize it. You are reading a page and all of a sudden the text jumps down. Or an image or video suddenly appears that pushes everything away from what you were doing. That is annoying and causes frustration. Because, for example, you can suddenly press the wrong button unintentionally.
These three factors determine the Core Dimensions of Quality. The core factors that determine quality.
Google has created three corresponding terms to measure these three factors. These are:
We will discuss each of these terms below, indicating good metrics to strive for.
How important are these quality factors? Google states that of the hundred web sessions that your website receives, 75 of them must provide good figures to be characterized as good quality and healthy website.
Other factors that play an important role are accessibility, security, and mobile-friendly. They also influence the overall user experience people have when they visit a website, according to Google.
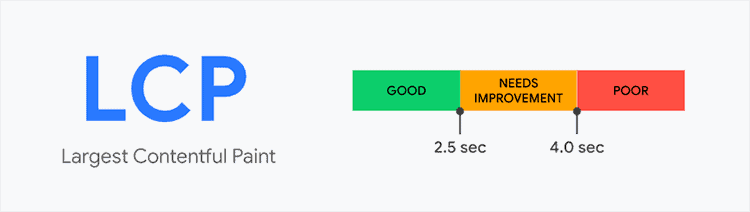
LCP describes how quickly a web page loads. In other words, how quickly a user can actually see the webpage and whether that corresponds to what they expected.
Google states that you are on the right track if your LCP is 2.5 seconds or less. If it is between 2.5 and 4 seconds you will have to fine-tune further. Anything above 4 seconds means there is real work to be done.
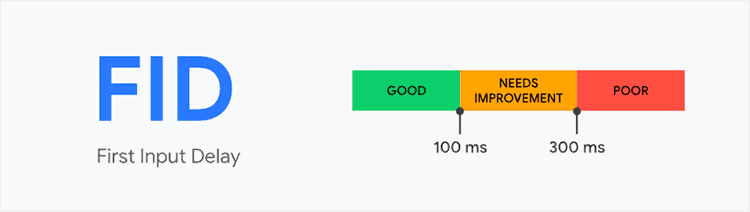
FID describes how long it takes for a web page to respond to user interaction. It may be that a web page is loaded and visible, but it can sometimes take a while before you can use it.
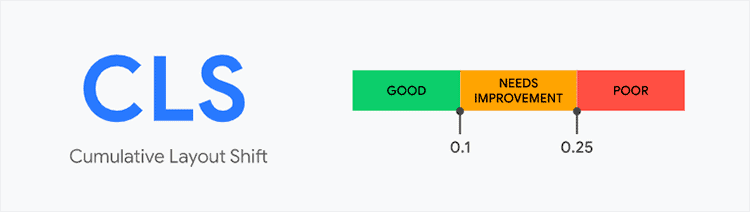
The cumulative layout shift measures how many elements of a web page shift during the web page load. Because people surf the Internet with different devices and web pages that are dynamically built, web browsers have to make adjustments when they show the web page.
The Total Blocking Time (TBT) metric measures the total time between First Contentful Paint (FCP) and Time to Interactive (TTI) where the session was blocked long enough to prevent response to input.
A session can consist of one or more consecutive tasks. If a page is slow or feels choppy, it can indicate blocked jobs.
The figure shows that there are 5 tasks where task 1, 2 and 5 have processing time which blocks the session. The TBT is the sum of all these moments.
Now that we know where you can further improve your website, you also need tools to measure these 3 elements. Google makes this possible for you in a number of different ways. First of all, through RUM data collection or the use of tools that Google makes available.
It starts with collecting RUM data. No, that does not mean the drink. RUM stands for “Real User Monitoring” and contains data from real users who visit your website. RUM data is also what Google uses to determine whether your website meets the standards of Core Web Vitals.
Monitis describes it as follows:
“Real User Monitoring is a form of web monitoring that records all end-user interactions with a website or an application at a much more detailed level and delves into statistics that the average user has probably never heard of. This analysis includes events such as DNS resolution, TCP connection time, SSL encryption negotiation, first byte transmission, navigation display, page rendering time, segments out of TCP order, and user think time.”
RUM data gives the best representation of how your website is doing. It shows in a detailed way and with direct feedback how your website is performing. So it pays to set up RUM.
Many businesses will have Google Analytics (GA) installed on their website for analysis. However, RUM and GA are quite different from each other because they have different goals.
Where GA should mainly be used is the collection and analysis of web data for SEO, lead generation and conversion tracking. Improving the overall marketing of the website both technically and in terms of content.
RUM, on the other hand, focuses more on finding the core performance issues that users may experience. This could be from long loading times of web pages, which could be caused by the browser, network, server or the content that needs to be downloaded and takes a long time to be processed. Maybe geographic location plays a role? What impact do all these things have on service level agreements (SLA)?
There are a number of other aspects in which RUM differs from Google Analytics. For more information you can read this here:
Source: https://www.monitis.com/blog/6-ways-real-user-monitoring-differs-from-google-analytics/
If you don’t have RUM installed, you can use the tools below to gain insight into the actual performance of your website.
Here is a handy overview of the tools available to create the web vital reports:
The easiest way to understand the performance of your website is by going to the URL below.
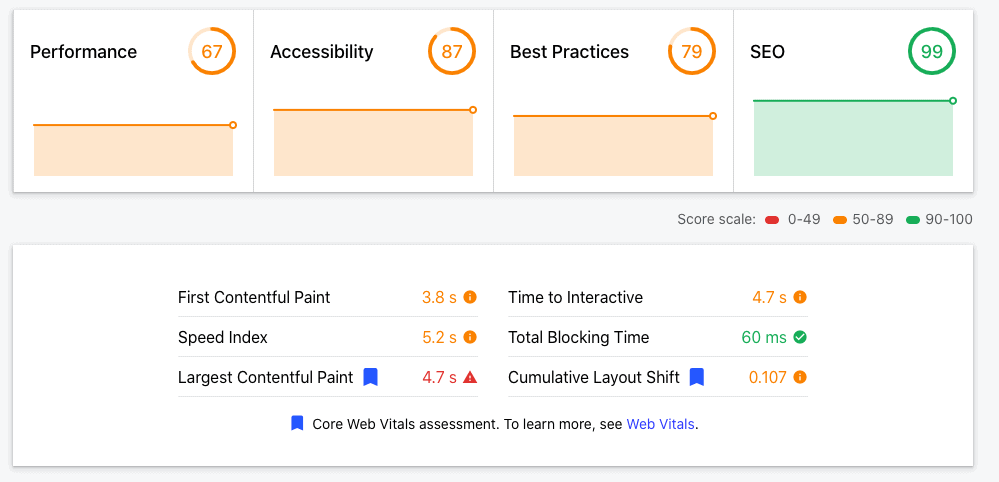
Enter the URL you want to research. Wait 20-30 seconds and you will see an overview of:
In addition, you also see the measured values for:
The tool also indicates in which areas you can improve things. A distinction is made in the impact (from high to low), the category (e.g. performance, accessibility, etc.), to which it specifically relates, and a link to more information about it.
PageSpeed Insights reports on total page-level and resource-level performance over the past 28 days. Also, it provides suggestions for improving performance. If you’re looking for a single way to get started measuring and improving your sit’s web core vitals then Google recommends using PSI. PSI is available via the Internet and as an API.
CrUX dashboard is a pre-built dashboard that displays CrUX data for a source or device of your choice. It was built using Google Data Studio and the installation process takes about a minute. Compared to PageSpeed Insights and Search Console, CrUX dashboard reporting contains more dimensions. For example, data can be broken down by device and connection type. The advantage of the CrUX is that you can view the measurement results over a certain period of time.
You can access your own CrUX via Google Data Studio via the following link:
Video how to set up the Chrome UX Dashboard:
Search Console displays performance data per page. This makes it great for identifying specific pages that need to be improved. Unlike PageSpeed Insights, Search Console reporting includes historical performance data. Search Console can only be used with sites that you own or control and have verified ownership.
You’ll find the Core Web Vitals option on the left side of the screen under the heading “Enhancements.”
Must Read Tip: Everything you need to know about Google Search Console.
You can find the Core Web Vitals report in the Chrome Web browser. The steps you need to take to do this are further detailed in the next chapter “Lighthouse Lab Data”.
Lighthouse reports on LCP, CLS, and TBT and also highlights potential performance improvements. The tool is available in Chrome DevTools, as a Chrome extension, and as an npm package. Lighthouse can also be integrated into continuous integration workflows through Lighthouse CI. It is also available in the Firefox web browser.
Lighthouse can be found in the Audit panel of Chrome DevTools.
How to run a report:
The Web Vitals Chrome extension measures and reports the Core Web Vitals (LCP, FID, and CLS) for a given page. This tool aims to provide web developers with real-time performance feedback as they make code changes.
You can download this plugin from the Google Chrome Extension web store via the link below.
https://chrome.google.com/webstore/detail/lighthouse/blipmdconlkpinefehnmjammfjpmpbjk
After you have installed the plugin, a lighthouse icon will appear in your browser at the top right.
How to run an audit:
Have you ever run an audit report in the past and would you like to see the results? You go to the URL below and upload the JSON or enter the GIST URL.
https://googlechrome.github.io/lighthouse/viewer/
WebPageTest includes Core Web Vitals as part of the standard reporting. It is useful for collecting information about Web Vitals under certain device and network conditions.
An advantage of WebPageTest is that it performs the test three times to calculate an average. It also shows a waterfall model of the loading time of the various elements that are loaded.
This allows you to find out which elements take the most time and any blockages.
Source: https://web.dev/vitals-measurement-getting-started/
All in all, there are many ways to request web vitals statistics via various tools. The best way is to use different tools, taking into account the source from which you request the web vitals data. For example, the web vitals data from your own web browser will be slightly different than when you have RUM data.
In the next chapter, we will look at the options for improving your LCP, FID, and CLS.
Now that you have several tools to measure the Core Web Vitals of your website, the question is now how can you improve your website? We will review each factor and indicate how you can optimize it.
LCP or Largest Contentful Paint describes how long it takes before something is visible on the device with which you visit a website or page.
The most common causes of a poor LCP score are due to:
My own experience concerning (WordPress) web optimization is that you can gain a lot from dealing with the long loading time of the webserver.
For example, you can optimize the htaccess file. Think of SSL redirect or inserting caching time for the various content you use. In addition, use a CDN (content delivery network) that acts as a kind of caching between the web server and the web user.
Another way that will yield a lot of profit is to optimize your content. Because websites contain more and more multimedia, we may use images that are too large. A lot of gains can be made by reducing them or using a better compression technique.
For an overview of LCP specific optimisations, please click here:
For some general web optimization tips you can find a few things here:
First Input Delay describes how long it takes for a web page to respond to user interaction. It gives an impression of how someone experiences a website in terms of interactivity and responsiveness.
The main cause of a long FID is the use of a lot of heavy Javascript. With Javascript, you can do fantastic things and give your website all kinds of extra possibilities. However, from a user perspective, you have to ask yourself whether that is necessary or purely because of a gimmick.
Using Javascript means that your device has to handle it like any programming language. For example, if your computer or smartphone is not that fast or if many other processes are running in the background, this has an impact on how quickly the website responds to someone’s device.
The profit you can achieve is by minimizing the use of Javascript or, if necessary, dividing the tasks in Javascript. Perhaps not all tasks need to be processed synchronously, but sharing can also be done asynchronously.
For more information you can read this here: https://web.dev/optimize-fid/
The Cumulative Layout Shift measures how many elements of a web page shift while the web page is loading.
Shifting elements on a web page after it has been loaded or when interaction is possible for the user is very annoying. It can cause wrong buttons to be pressed or other unexpected intentions.
Popups, for example, is a good example where your screen is suddenly taken over by a script while the user did not initiate it himself.
The most common causes of bad CLS are:
Example of an image without dimensions defined:
You can avoid this by defining the dimensions like this:
<img src = “photo.jpg” width = “640” height = “360” alt = “Photo”>
Nowadays, web builders, such as Divi and Elementor, add this automatically. Still, it is good to pay attention to this if you build the web pages by hand.
Another tip that Google advises is to keep spaces free in advance for the ads and other pieces that will be dynamically added later in the page. As a result, no more moves will happen and the page will remain the same in terms of layout.
It is also recommended not to add content on top of existing and loaded content. This causes shifts from the top. Adding content to the bottom is the way to go.
Web fonts that are later applied to the already loaded text are what is often encountered with slow connections. This can also cause a shift in the layout. The way to avoid this is to make sure that the user’s Web fonts are already loaded before building the web page.
For more tips on optimizing the CLS you can find here:
Web vitals is an important step towards more robust and increased user-friendliness for Internet users. Google gives developers tools to zoom in deeper to important metrics when it comes to loading a web page and building the layout of pages.
Google shows with this that they and users want to quickly see what is on a page, that users want to interact immediately and that the image of the page remains consistent.
Use the tools and optimize your web pages!